


Description
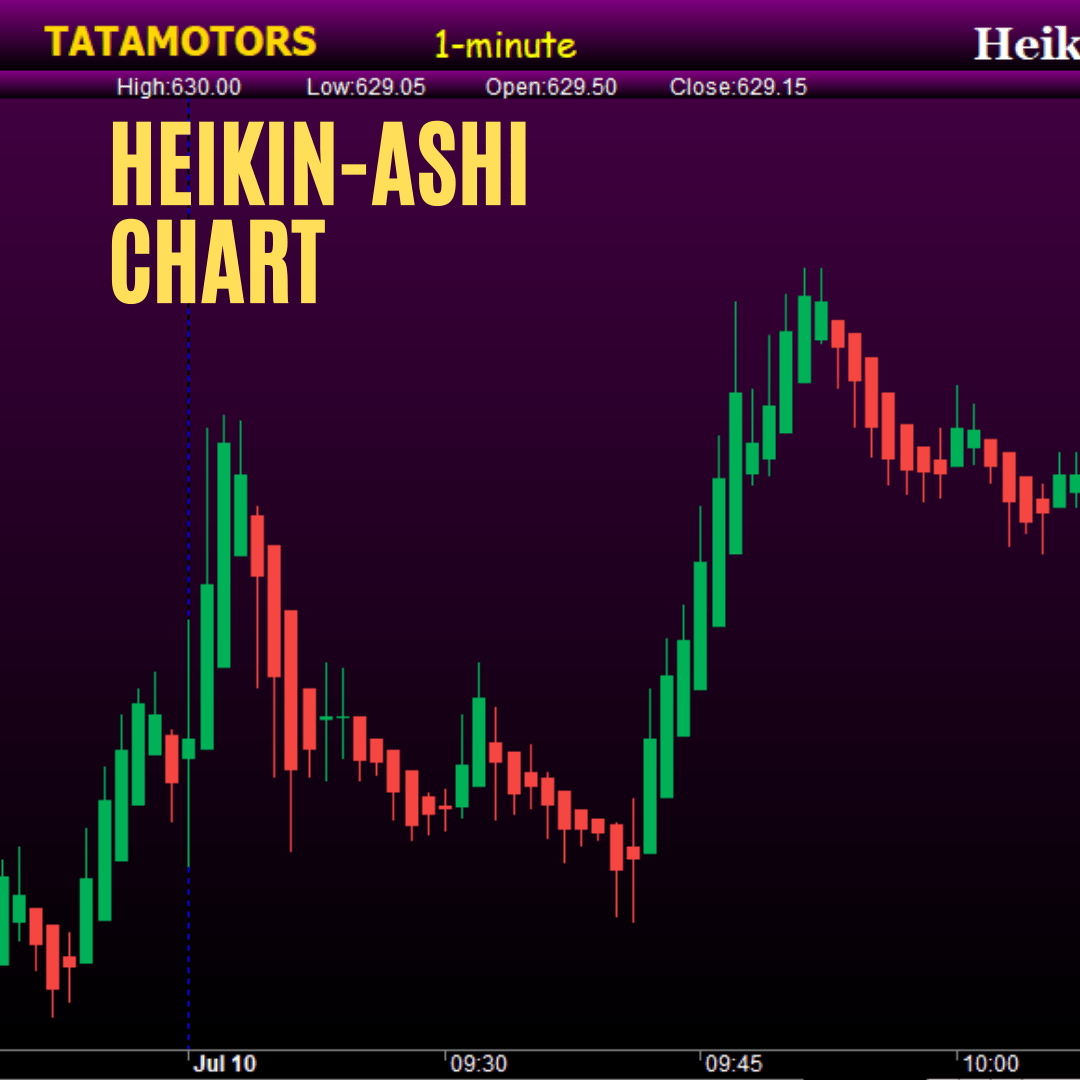
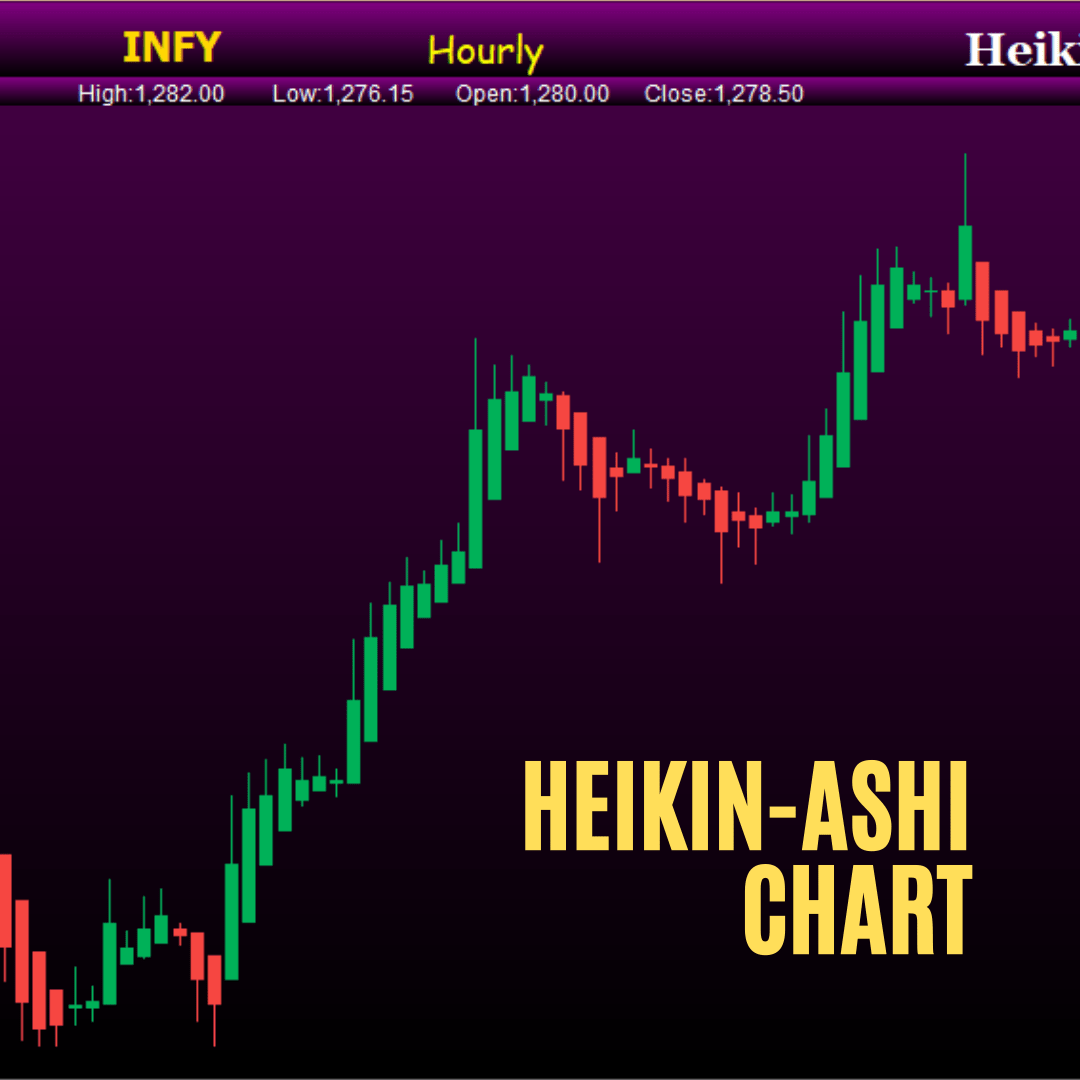
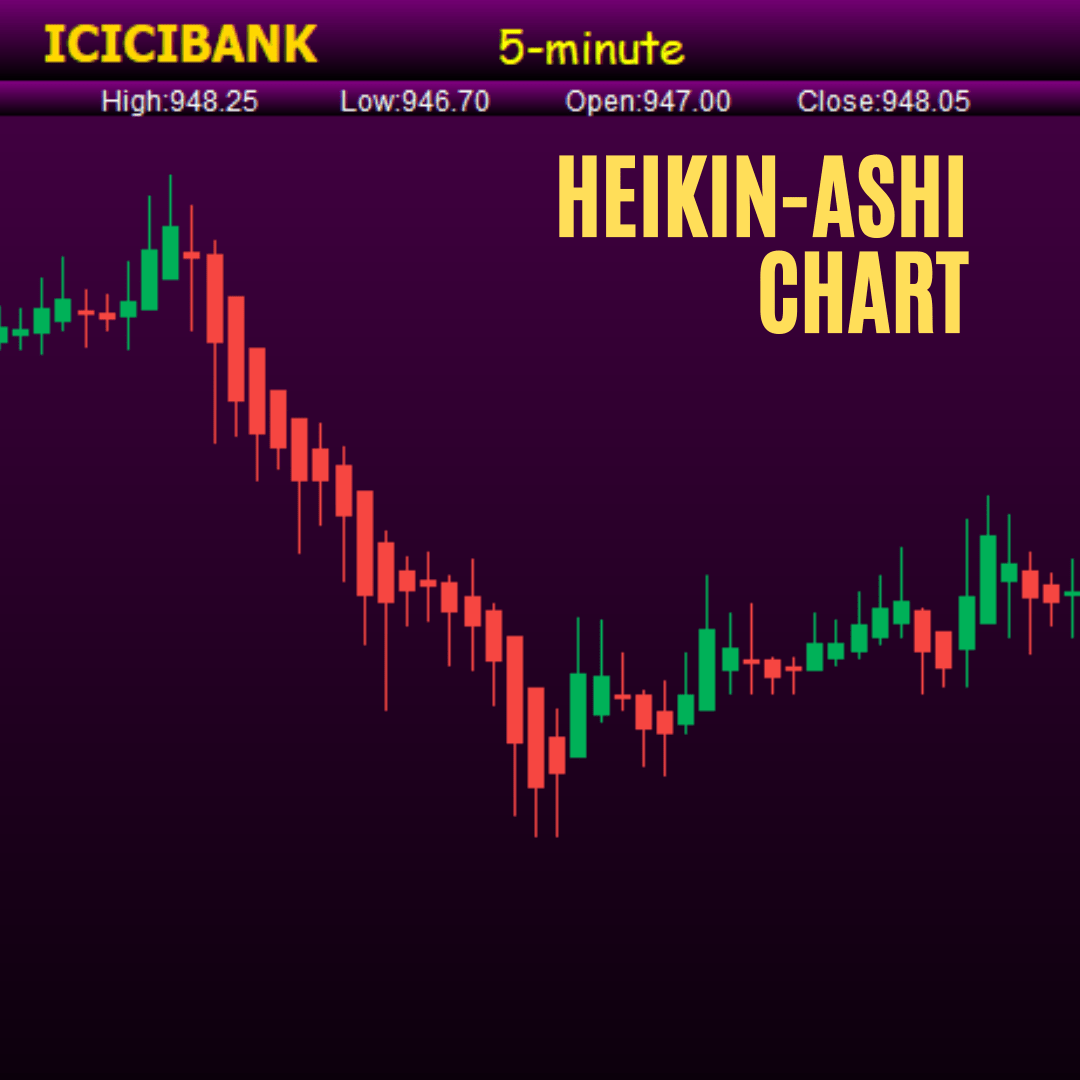
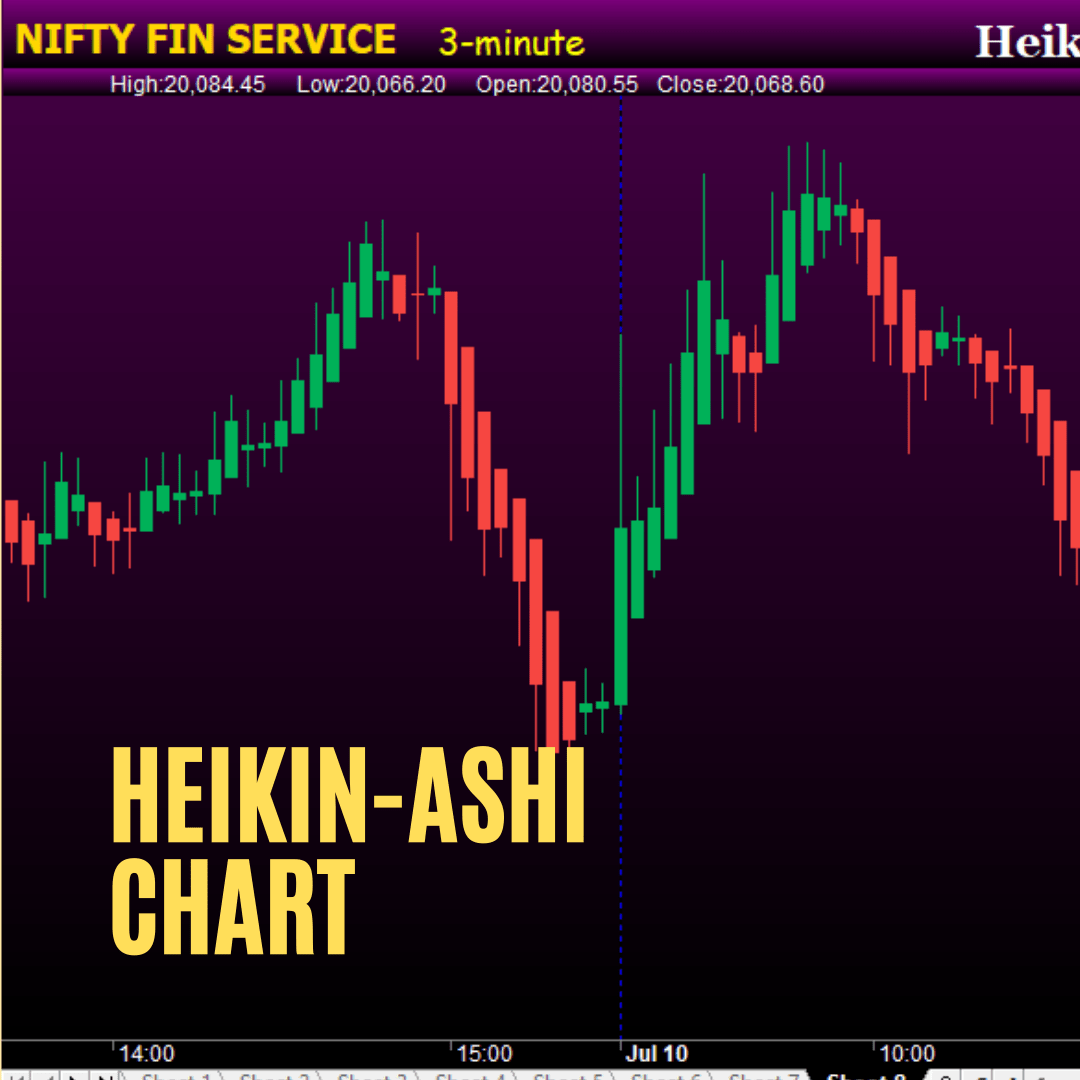
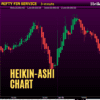
The Heiken Ashi charting technique offers several benefits to traders and technical analysts. This unique charting approach, which replaces traditional candlestick charts with modified calculations, provides a smoother representation of price trends and offers valuable insights into market behavior. Here are some of the key benefits of using Heiken Ashi:
- Smoothing Price Action: Heiken Ashi charts help to filter out market noise and present a clearer picture of price movements. By averaging the current and previous bar’s price data, Heiken Ashi eliminates the sharp fluctuations and random noise that can occur in traditional candlestick charts. Traders can better focus on the underlying trend and avoid getting distracted by short-term price volatility.
- Trend Identification: One of the primary advantages of Heiken Ashi charts is their ability to identify trends. The smoothed candlesticks make it easier to spot and follow the direction of the trend, whether it’s an uptrend, downtrend, or sideways movement. Traders can use Heiken Ashi charts to confirm the prevailing trend and make more informed trading decisions.
- Reversal Patterns: Heiken Ashi charts are effective at highlighting potential trend reversals. By changing the color of the candles, from bullish (typically green or white) to bearish (usually red or black), Heiken Ashi signals a potential shift in market sentiment. Traders can watch for a series of consecutive candles of the opposite color, indicating a possible reversal or trend change.
- Gap Elimination: Heiken Ashi charts help eliminate gaps that can occur due to overnight price jumps or sudden market discontinuities. These gaps can distort the analysis of price patterns and trends. By smoothing out the price action, Heiken Ashi provides a continuous representation of price movement, making it easier to interpret chart patterns and trends.
- Support and Resistance Levels: Heiken Ashi charts can assist in identifying key support and resistance levels. The highs and lows of the Heiken Ashi candles can act as reference points for identifying areas of price congestion or significant price levels. Traders can use these levels in conjunction with other technical analysis tools to make more accurate trading decisions.
- Entry and Exit Signals: Heiken Ashi charts can generate valuable entry and exit signals. Traders often look for specific patterns or conditions, such as crossovers of Heiken Ashi Open and Close or breakouts from key levels, to generate trading signals. By combining Heiken Ashi signals with other technical indicators or chart patterns, traders can enhance their entry and exit timing.
- Trend Following Systems: Heiken Ashi charts are commonly used in trend following trading systems. Traders can employ Heiken Ashi to confirm trend direction and filter out false signals. By aligning trades with the prevailing trend indicated by Heiken Ashi, traders aim to capture longer-term price moves and increase the probability of successful trades.
- Visual Clarity: Heiken Ashi charts offer a visually appealing representation of price action. The smoothed candles and the absence of noise provide a cleaner and less cluttered chart, making it easier for traders to interpret and analyze the price trends. This enhanced visual clarity can improve decision-making and reduce trading errors.
It is important to note that while Heiken Ashi charts offer valuable insights, no single charting technique or indicator can guarantee accurate predictions. Traders should combine Heiken Ashi analysis with other technical analysis tools, risk management strategies, and fundamental analysis to make well-rounded trading decisions. Additionally, thorough testing and evaluation of Heiken Ashi-based strategies on historical data are recommended before using them in live trading environments.

Reviews
There are no reviews yet.