Candlestick charts have been a popular tool used in technical analysis for decades to visualize price movements in financial markets. Traders and investors have relied on these charts to make informed decisions about buying or selling financial instruments such as stocks, currencies, and commodities. However, with changing market dynamics and the evolving landscape of trading and investing, there are growing concerns about the effectiveness and relevance of candlestick charts in the future.
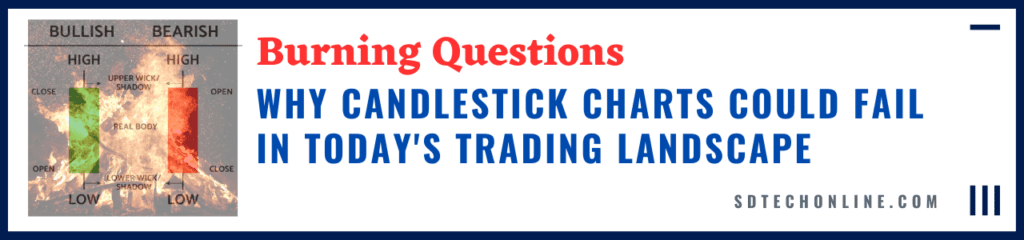
Candlestick charts, also known as Japanese candlestick charts, were developed in Japan in the 18th century and gained popularity in the Western world in the 20th century. They provide visual representations of price movements over a specified time period, showing open, high, low, and close prices in the form of “candles” with different colors and shapes. Various candlestick patterns and formations are used to identify potential trend reversals, trend continuations, and other trading opportunities.
Despite their historical significance and widespread use, there are several reasons why candlestick charts may not work as effectively in the future.
Table of Contents
1. Increasing Market Complexity.
Today’s financial markets are highly complex and dynamic, with a plethora of factors influencing price movements. Market participants now have access to vast amounts of data, including real-time market data, news, economic indicators, and social media sentiment, which can impact market trends. Candlestick charts, which rely solely on historical price data, may not fully capture the increasing complexity and interconnectedness of today’s markets, making it challenging to accurately predict future price movements.
2. Changing Trading Patterns
Trading patterns and behaviors have evolved significantly over time, driven by advancements in technology and changes in market structure. High-frequency trading, algorithmic trading, and other automated trading strategies now dominate financial markets, leading to rapid and sometimes unpredictable price movements. These changing trading patterns may not be adequately reflected in candlestick charts, which are based on historical price data and may not capture the nuances of modern trading practices.

3. Market Manipulation and Artificial Intelligence.
With the rise of technology, market manipulation has become a growing concern. Manipulative practices such as spoofing, front-running, and pump-and-dump schemes can distort market trends and create false signals on candlestick charts. Additionally, the increasing use of artificial intelligence and machine learning in trading can further impact market dynamics and generate complex trading patterns that may not be accurately represented by candlestick charts.
4. Limited Predictive Power.
While candlestick charts can provide insights into past price movements, their predictive power is often debated. Some argue that the historical patterns observed in candlestick charts may not always repeat in the future, as markets are influenced by ever-changing factors. Moreover, candlestick charts rely on subjective interpretations of patterns, and different traders may interpret the same pattern differently, leading to varying trading decisions and outcomes.
5. Lack of Context.
Candlestick charts only provide information about price movements and do not consider the broader market context. Factors such as market sentiment, macroeconomic conditions, geopolitical events, and news announcements can significantly impact price movements, but may not be reflected in candlestick charts alone. Without considering the broader context, traders may make incomplete or inaccurate trading decisions based solely on candlestick patterns.
6. Overreliance on Candlestick Charts.
Some traders may rely solely on candlestick charts without incorporating other technical or fundamental analysis tools, leading to an overreliance on this single method of analysis. This can lead to missed opportunities or incorrect trading decisions, as no single tool or method is infallible. It is important to use candlestick charts in conjunction with other technical indicators, fundamental analysis, and risk management strategies for a holistic approach to trading.
7. Rapidly Changing Market Conditions.
Market conditions can change rapidly, and what may have worked with candlestick charts in the past may not be as effective in the future. Market trends, volatility, and liquidity can change quickly, and candlestick charts may not always capture these rapid changes accurately. Traders need to adapt to the evolving market conditions and consider multiple sources of information to make informed trading decisions.
8. Alternative Charting Methods.
With advancements in technology, there are now various alternative charting methods available that traders and investors can use. For example, line charts, bar charts, point and figure charts, and Renko charts are some alternative charting methods that provide different perspectives on price movements. These alternative methods may offer unique insights and patterns that may not be visible on candlestick charts alone, making them attractive to traders who seek diverse tools for market analysis.
9. Shift Towards Quantitative Trading.
Quantitative trading, also known as algorithmic or systematic trading, has gained significant popularity in recent years. Quantitative trading strategies rely on complex mathematical models and algorithms to analyze market data and execute trades automatically. These strategies often prioritize quantitative data over visual chart patterns, making candlestick charts less relevant in such trading approaches.
10. Emphasis on Data-Driven Analysis.
With the growing availability of big data and advanced analytics, there is a growing emphasis on data-driven analysis in trading and investing. Traders and investors now rely on sophisticated quantitative models, machine learning algorithms, and artificial intelligence tools that process vast amounts of data to identify patterns and trends in the markets. These data-driven approaches may prioritize quantitative data and statistical analysis over traditional charting methods, including candlestick charts.
In conclusion, while candlestick charts have been a popular tool for technical analysis in the past, their effectiveness may be challenged in the future due to increasing market complexity, changing trading patterns, market manipulation, limited predictive power, lack of context, overreliance, rapidly changing market conditions, availability of alternative charting methods, shift towards quantitative trading, and emphasis on data-driven analysis. Traders and investors need to adapt to the changing landscape of trading and investing and consider multiple sources of information and diverse tools for market analysis. Candlestick charts may still have value as one of the many tools in a trader’s toolkit, but they may not be relied upon solely for making trading decisions. Traders should incorporate other technical indicators, fundamental analysis, risk management strategies, and stay updated with evolving market dynamics to make well-informed trading decisions in the future. Flexibility, adaptability, and a holistic approach to market analysis will be key to successful trading in the ever-changing financial markets.