

Description
The Super Trend indicator takes two main parameters: the length and the multiplier. The length parameter determines the number of bars used to calculate the average true range (ATR), which measures volatility. The multiplier parameter adjusts the distance of the upper and lower bands from the average price based on the ATR. This indicator can be effectively implemented and customized using Amibroker AFL, allowing traders to automate and optimize their trend-following strategies.
The Super Trend indicator is calculated as follows:
- Calculate the ATR using a specified length, typically 14 periods, to measure the volatility of the market.
- Determine the basic upper and lower bands by adding or subtracting a multiple of the ATR from the average price (usually the sum of the high and low prices divided by 2).
- Calculate the final upper and lower bands by comparing the current closing price with the previous final upper and lower bands. If the closing price is below the previous final upper band, use the basic upper band; otherwise, use the minimum value between the basic upper band and the previous final upper band. If the closing price is above the previous final lower band, use the basic lower band; otherwise, use the maximum value between the basic lower band and the previous final lower band.
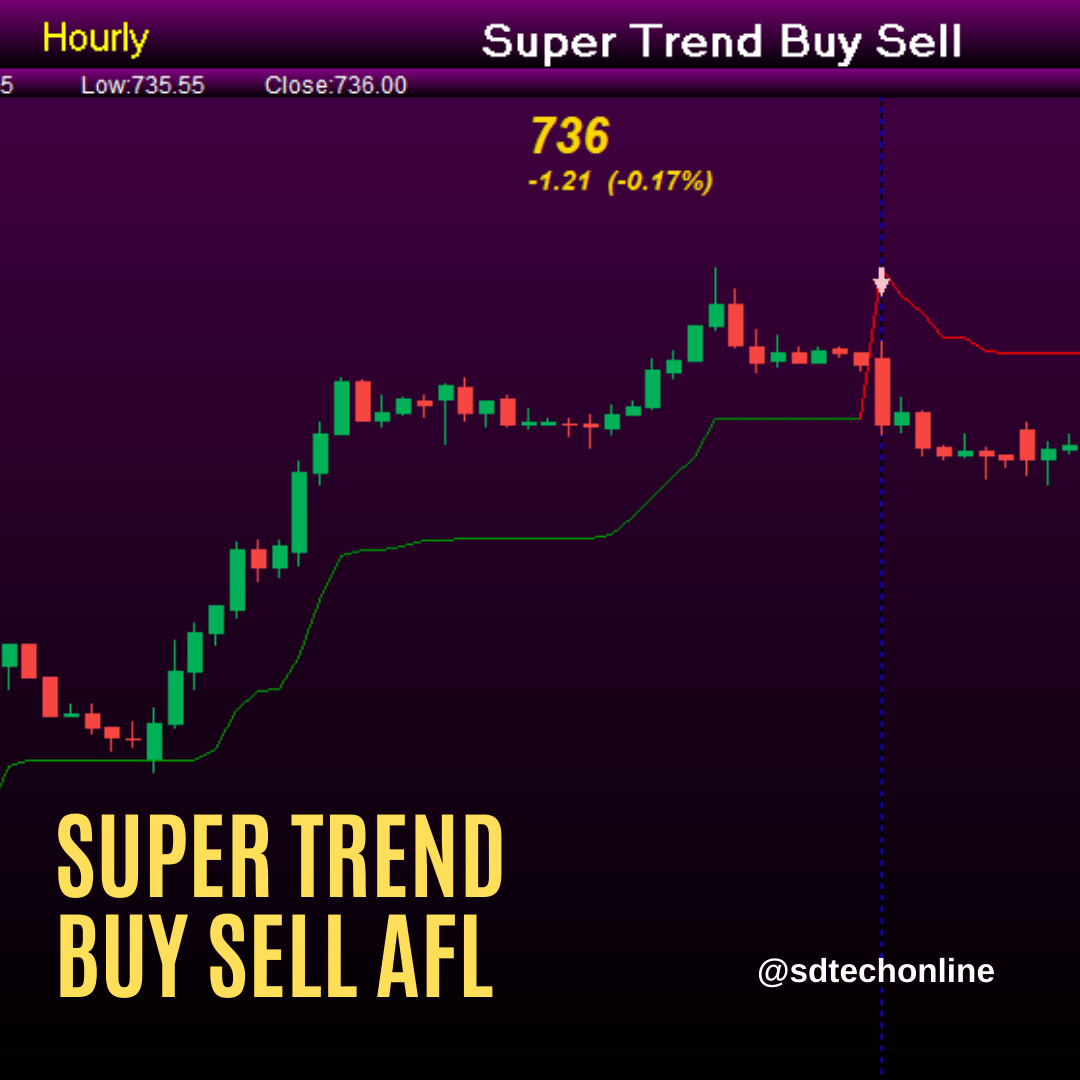
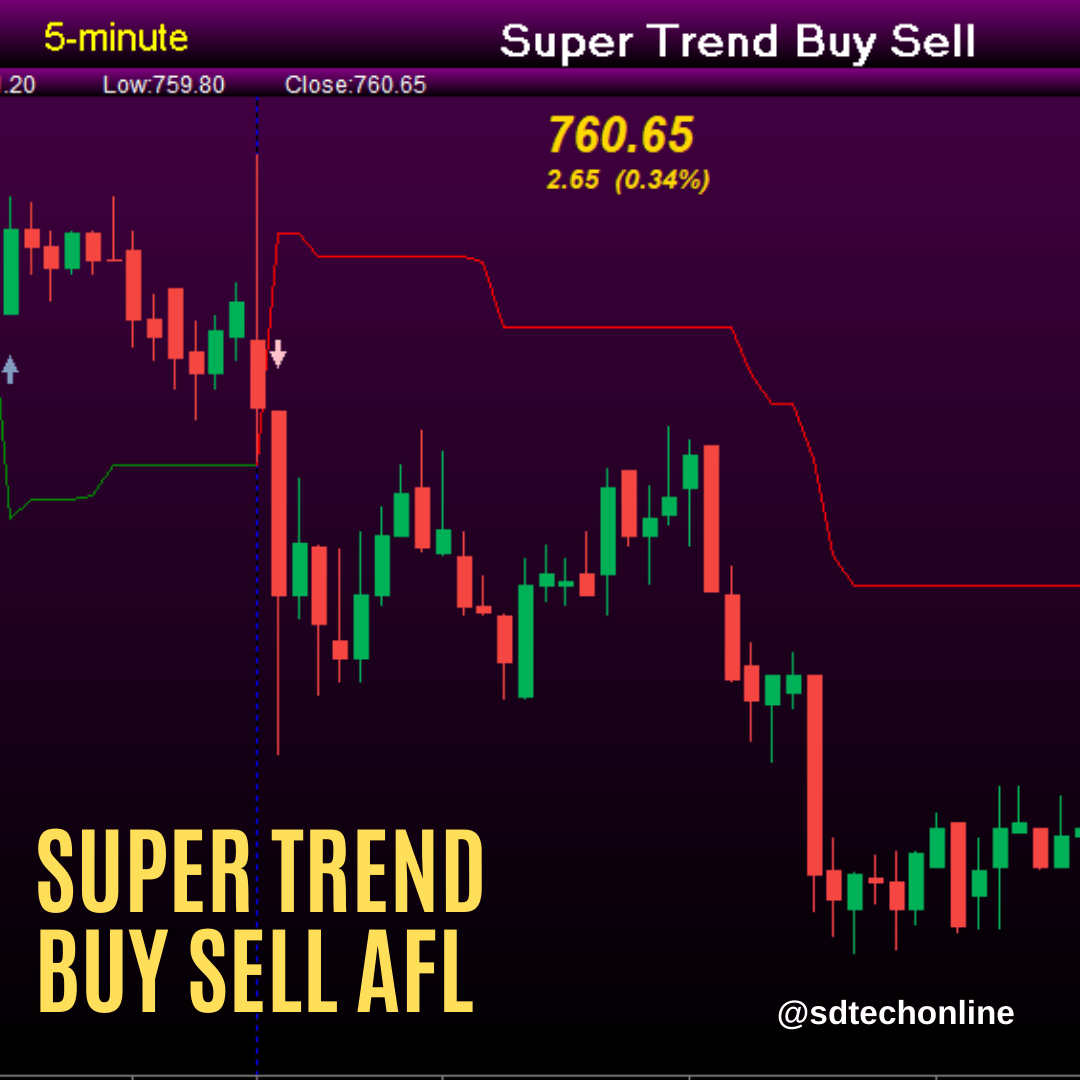
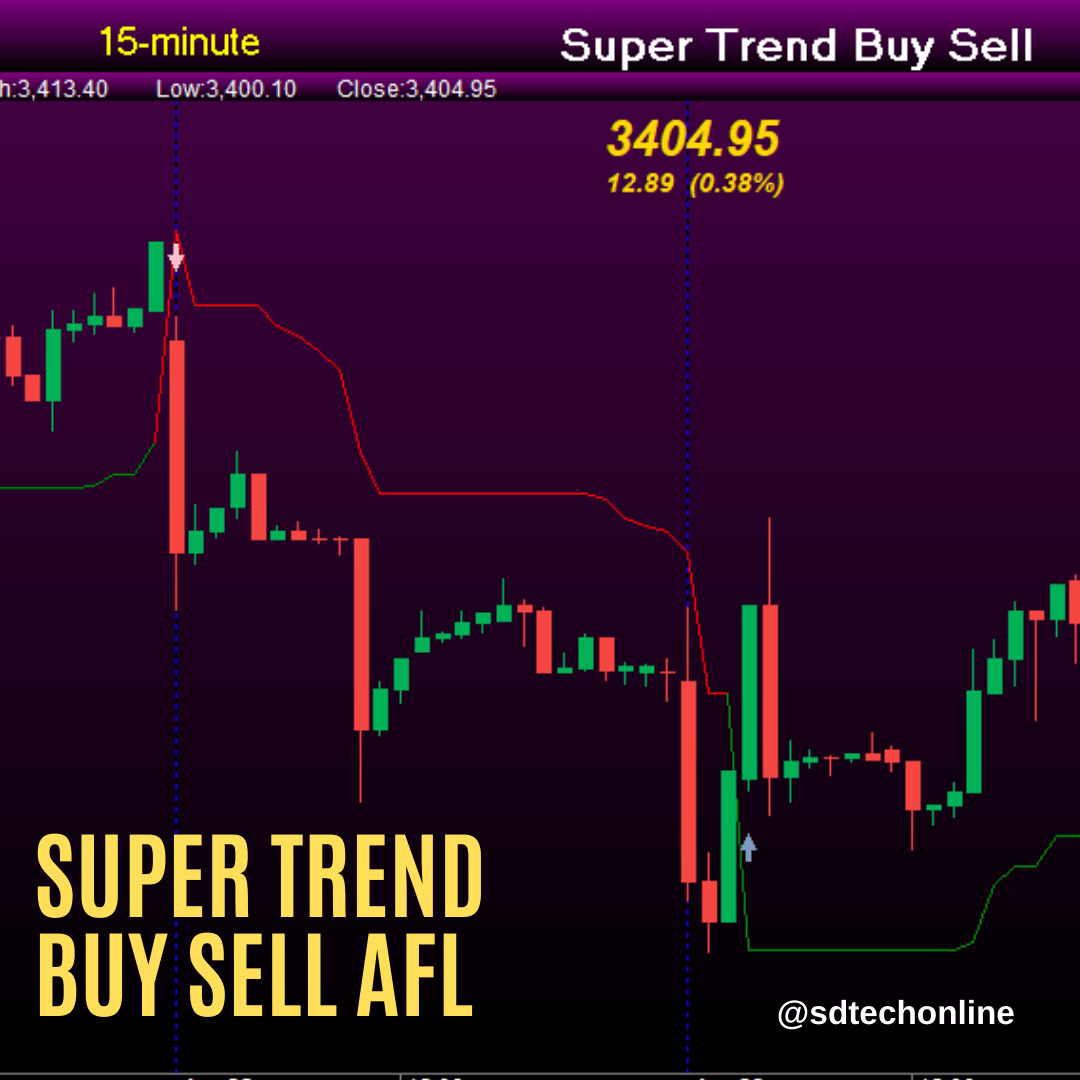
- Generate the buy signal when the closing price crosses above the final lower band, indicating a potential bullish trend. Conversely, generate the sell signal when the closing price crosses below the final upper band, indicating a potential bearish trend.
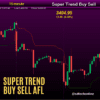
The Super Trend buy/sell signals can be visualized on the chart using graphical elements such as arrows or dots. When a buy signal occurs, an arrow or dot is placed below the candlestick or bar, indicating a potential entry point for a long position. Similarly, when a sell signal occurs, an arrow or dot is placed above the candlestick or bar, indicating a potential entry point for a short position.
Traders often use Super Trend buy/sell signals in conjunction with other technical analysis tools, such as moving averages or trendlines, to confirm the strength of the signals and make more informed trading decisions. Additionally, risk management techniques, such as setting stop-loss orders and position sizing, should be applied to manage risk and protect capital.
It’s important to note that while the Super Trend indicator can be a useful tool for identifying trends and generating buy/sell signals, it should be used in conjunction with other analysis techniques and considered within the broader market context. Traders should also thoroughly test and validate the indicator’s performance using historical data before applying it to live trading.


An –
Grateful you for sharing your expertise with us all. Your enthusiasm for your topics shines through.